Tracking the spread and outcome of the coronavirus in Ecuador:
UPDATED FOR MONDAY, JUNE 21, 2020
First, we need to notify readers of an update to the spreadsheet of information accompanying this report. You’ll notice that a new field “POSITIVE TESTS AS % TOTAL TESTS” has been added to the prior statistics. We’ve done this to illustrate a point that has caused some confusion here, and in other countries.
This relates to the idea that by increasing the number of tests taken, a region should expect to see more positive tests. While that may be true, measuring the percentage of positive tests against the total number of tests can give you an indication of whether viral spread is getting better or worse.
This is a statistic that we in fact should have been following all along. We apologize for not providing that. As you will see in the spreadsheet, we have calculated that number back to when we began tracking the data for this report.
So, what does this tell us?
Tracking the percentage of positive tests against total tests actually shows us that since May 10, 2020, there has been a continuous decrease in the percentage of positive tests versus total tests taken.
However, while the rate of decrease of positive tests decreased noticeably in prior weeks, for the week ending June 20, 2020, the decrease versus the prior week is almost unmeasurable (0.06%).
Now, with that said, it is important to point out that there were only 4,739 new samples taken over the last week, but there were 9,199 tests run—so only about 51.5% of the tests were from this past week, the rest were taken from backlogged samples (assuming that they are running new samples first, then clearing the backlog).
Nonetheless, those new samples, if they were part of the 9,199 tested, do give us a significant sample size to say that the viral spread is nearly unchanged from last week.
Cuenca’s issues have improved
Last week we raised a concern that both Azuay province and Cuenca had seen their rates of new cases and new deaths increase for the first time in two weeks, and we pondered if this would lead to worsening numbers this week.
This week’s numbers still give us pause for concern. Though there has been some improvement, the rate of deaths in Azuay province has continued to climb.
However, that may be because there continue to be patients in hospitals throughout the country who have been in ICU care for extended periods of time; we may only now be seeing their deaths after prolonged periods of unsuccessful treatment.
The positive side of the numbers are that both Azuay province and Cuenca saw decreases in the rate of new cases. Azuay saw a rate of increase of only 10.09% versus 23.05% the week before. Cuenca saw an increase of 10.59% versus 24.54% the prior week.
In fact, the rates of increase over this past week are even better than they were for the week of June 6, 2020.
This give us reason to believe that Cuenca has passed the “bump” in numbers that occurred after moving from RED to YELLOW epidemiological designation.
Regardless, the Cantonal Emergency Operations Committee (COE)is continuing the YELLOW designation for the immediate future.
Nationwide travel has resumed
Last week we also discussed the opening of interprovincial travel and National airline flights within the country.
Since that time, the city of Guayaquil has protested that passengers on National flights were not being tested prior to departure from other cities. In one instance, 21 people arriving on a flight from Quito to Guayaquil were said to test positive with a Rapid Test.
Because of this issue, the Ministry of Transport and Public Works has released a new provision requiring all passengers arriving in the Quito or Guayaquil airport, to show proof of a negative PCR test. The test must be no older than 72 hours.
The Corporación Aeroportuaria de Cuenca (CORPAC), which manages the Mariscal La mar airport in Cuenca, is requiring all passengers to present their test results prior to being allowed to board any aircraft.
The test must be done by laboratories that are certified by the Ministry of Public Health(MSP). The list is available at the following link: http://www.calidadsalud.gob.ec/laboratorios-autorizados/.
THE NUMBERS
Last week we reported that nationwide, the numbers were fairly good even though the country had loosened restrictions the prior week.
Only 7(of 24) provinces had seen an increase in the rate of new positive test results (as opposed to 19 the prior week). One of these provinces (the Galapagos), only had 1 new case. However, the rate of increase in deaths rose in 13 provinces.
We are happy to say that those numbers continue to improve; this week only 5 provinces saw the rate of new cases increase over last week, and only 10 provinces saw an increase in the rate of deaths.
However, as pointed out earlier, the percentage of positive tests against total number of tests has virtually stayed the same week over week.
How accurate are the numbers?
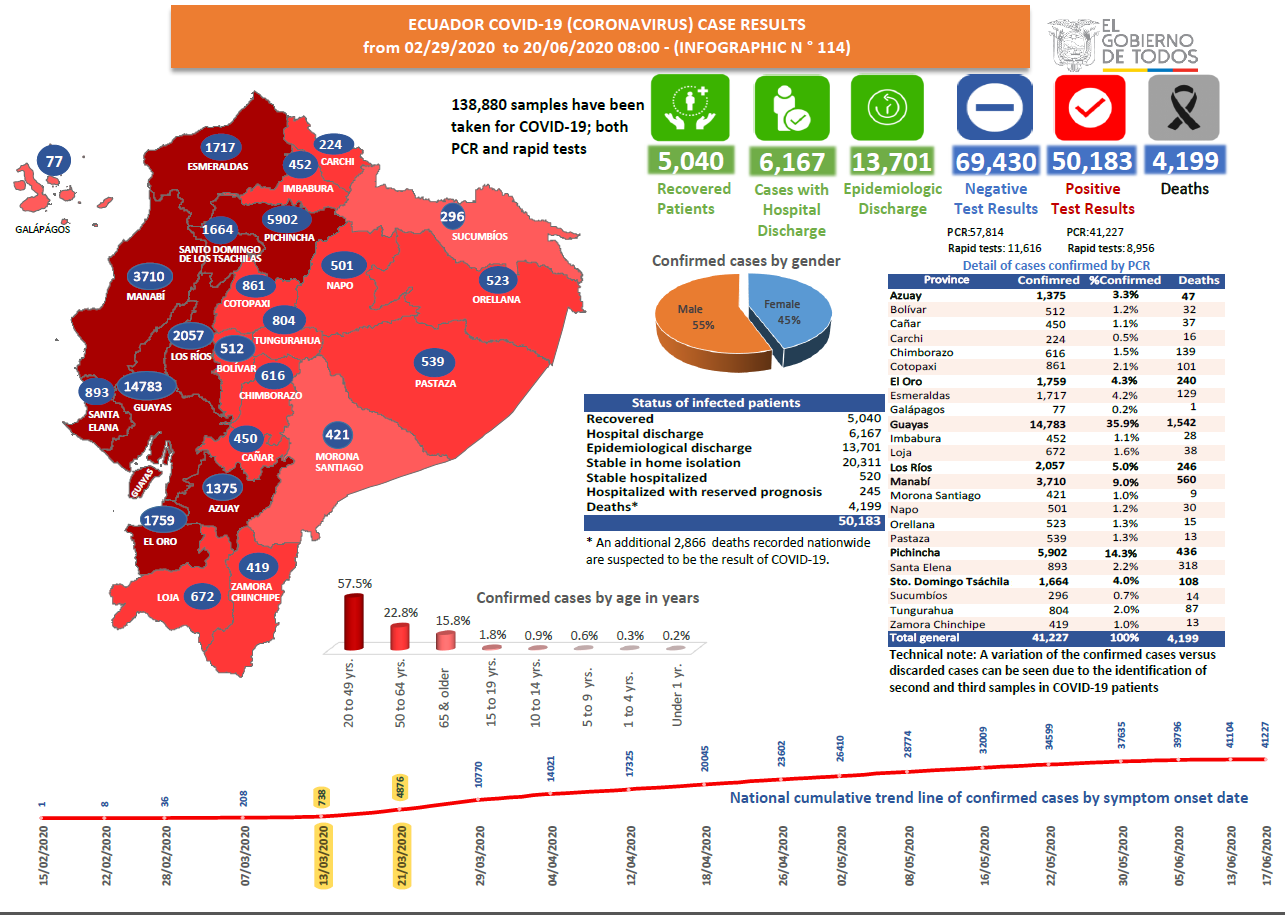
The graphic accompanying this article is provided by the government (it has been modified for easier readability). The numbers and statistics below are based on all case data collected by the government as of 8:00 a.m. on Sunday, June 20, 2020. More detail of all of the numbers in the graphic follow below.
Like many countries across the globe, Ecuador does not know the actual numbers of people infected by the coronavirus or the total number of deaths that can be attributed to COVID-19.
The numbers in the graphic below reflect the number of people who tested positive or negative for the virus,with both the polymerise chain reaction or (PCR)test which looks for antigens and identifies the presence of the virus in the body, and the “Rapid” test which looks for antibodies to the virus and identifies a person’s immune response to the virus. The PCR test gives an earlier identification of those who have been infected by the coronavirus and whether they have an active infection. Ecuador is now only reporting new PCR test results (however, prior Rapid tests are included in its report).
These numbers do not reflect the actual total number of people infected across the country or the number of deaths that can be attributed to COVID-19.The dates on the graphic are also adjusted back to when symptoms began, not when the positive test occurred.
The numbers below are compared at a provincial level.This is a critical point to keep in mind; in many cases, there are cantons that have been able to lift restrictions even though they are in a province that has actually shown increases in positive tests and deaths at a higher rate than the prior week. However, the decisions to loosen restrictions are being made at the level of the canton, not the province.
For those who want a deeper level of information for a particular town or city, click here.
Some of the numbers have been adjusted; in some towns the number of cases may have gone down, but the number of deaths may have gone up, or vice versa. This is because the government has been critically evaluating the cause of death information in its database and also removing duplicate records. Information is now being followed by national ID card numbers (i.e., Cedula number) rather than by name.
Rate Of New Positive Cases/ Deaths Compared To Prior Week
There is good news across the country regarding the rates of new positive cases being reported.
Nineteen provinces saw a decrease in this figure; what is more encouraging is that 9 provinces saw this number improve for the second week in a row (as opposed to 2 provinces last week).
Also, there was an increase in the rate of new deaths in only 10 provinces this week, 3 less than last week. However, it was found for two weeks in a row for 4 of those provinces.
Increase in rate of new cases
The five provinces that saw an increase in the rate of new cases were: El Oro (16.18%), Napo (28.46%), Pastaza (37.50%), Santa Elana (4.2%), and Sto. Domingo Tsachilas (20.06%).
Of these, El Oro and Santa Elana had almost negligible increases. While Sto. Domingo Tsachilas saw about a 3% increase for the second week in a row.
Increase in rate of deaths
Several of the 10 provinces with higher death rates stood out this week (in red). While some others had high numbers, their increase over the prior week was minimal. The 10 provinces in this group—with this week’s figure versus last week’s increase—were: Azuay (14.63% versus 13.89%),Carchi (23.08% versus 8.33%), Chimborazo (10.32% versus 7.69%), Cotopaxi (48.53% versus 13.33%), Esmeraldas (26.47% versus 7.37%), Guayas (3.28% versus 1.70%), Imbabura (47.37% versus 35.71%), Orellana (87.50% versus 14.29%), Pastaza (85.71% versus 16.67%), and Tungurahua (7.41% versus 5.19%).
Azuay saw its rate of deaths increase for the third week in a row. Chimborazo,Cotopaxiand Imbaburaall saw their rates of deaths increase for two weeks in a row.
Increased rates of cases and deaths
The other positive number for this week is that only 1 province—Pastaza—had increases in both the rates of new positive test results and deaths. This was after having decreases in both figures the prior week.
[For a detailed spreadsheet of all of the statistics, follow this link]
Nationwide changes in numbers for the last two weeks
For the second week in a row, looking at the numbers nationally offers some optimism toward the progression of the health emergency.
Both the rate of increase of new cases (9.08%) and deaths (7.78%) have fallen slightly from last week and the number of tests in a backlog (-18.80%) has fallen more than any previous week.
Also, while the number of “probable COVID-19” related deaths has increased, the rate of increase (7.54%) has fallen by more than 2% from the prior week (9.72%).
Even though the numbers are improving, we are still concerned with the government’s testing efforts. The number of samples collected (3.53%) has fallen again for the fifth week in a row. Similarly, the number of tests run has also fallen again (8.33%) for the second week in a row. This means less tests have been run for 4 of the last 5 weeks.
By having a reduced amount of sampling being done, less tests being completed and a continuous backlog of untested samples, the ageing of the data the government is collecting becomes a distinct possibility. One that could lead it to getting too far behind the data to find trends that may be reappearing later in the year.
Graphical Highlights
Here is a quick review of the graphical highlights below (as of Sunday, June 20, 2020 at 8:00 a.m.):
- 4,199 deaths have been attributed to COVID-19
- Another 2,866 deaths are “suspected” to be attributable to COVID-19
- 138,880 test samples have been taken collected
- 50,183 tests have returned positive (+)
- 69,430 tests have returned negative (-)
- 19,267 test samples remain “dammed” or backlogged in the testing process
- 5% of the deaths have been among the ages 20 to 49 years old
- 8% of the deaths have been among the ages 50 to 64 years old
- Only 15.8% of the deaths have been among the ages 65 years and older
- 55% of cases have been on males, 45% in females
- Guayas province accounts for 35.9% (down from 38.7% last week) of confirmed cases (14,783) and 36.74% (down from 38.32% last week) of the confirmed deaths (1,542)
- Pichincha province accounts for 14.3% of confirmed cases (5,902) and 10.38% of the confirmed deaths (436). Both of those figures are increases over last week.
- Azuay province accounts for 3.3% of confirmed cases (1,375) and 1.12% of the confirmed deaths (47).Both of those figures are nearly unchanged from last week.
- No province has escaped deaths due to COVID-19


Thanks for a clear and informative report. Hopefully, it will continue to improve as data reporting improves.